Winners
Thank you to all who participated in the #VizRisk Challenge! Your enthusiasm and engagement throughout the two months were wonderful, and we are grateful for the time you all put in to every aspect of the challenge. We are pleased to announce the winners of the Challenge and hope that you enjoy going through them as much as we did:
Grand Prize Winner
RIESGO, by Briane Paul V. Samson and Unisse C. Chua. Read their blog
Category Winners
Best data analysis
Hurricane Maria’s impacts in Dominica, by Karen Barns, Ji Su Lee, Nicole Paul, Tim Arioto, Tamika Bassman, and Angela Wilson. This team used OpenStreetMap data to fill gaps in publicly available datasets so they could explore data analyses to inform recovery planning in Dominica. Read their blog to get the details on their data analysis techniques for this project.
Best visual design
After The Quake, by Sabine Loos, Karen Barns, and Arogya Koirala. The design of this entire project is stunning, though our judges especially appreciated the thoughtful selection of color palettes for data layers and the complementary custom map style. Read their blog to learn about their motivation and process for this project.
Best interaction design
RIESGO, by Briane Paul V. Samson and Unisse C. Chua. Also the grand prize winner, this project effectively combines several interaction formats to communicate the results of their risk analysis, with an overarching “scrollytelling” interaction that sequentially presents viewers with additional interactions including hover, pop-ups, overlays, and layer toggles. Read their blog for more on the design of this project.
Best write-up
Visualizing Risk: Remotely Triggered Earthquakes, by Will Chase. The uncontested winner of this category, Will’s blog post reads like an adventure journal through the experience of identifying a topic, researching it, collecting and analysing data, designing a visualization, and then building it. Complete with code snippets and lots of links, this blog post is definitely one to read.
Best city-scale visualization
Mount Agung, Bali, by Rizki Fadhilah, Hanfie Vandanu, Aulia Arfida, Mahendra Aulya, and Rooseno Rahman D. This team dove into a custom location and hazard – volcanic eruptions on the island of Bali, including manually digitizing the location of tourist sites in the districts close to Mount Agung. Read their blog to learn about this project.
Best national-scale visualization
ur-scape Nepal, by David Neudecker. This project used datasets from Nepal suggested for the VizRisk Challenge, combined with further data on likely travel routes created using Space Syntax analysis extension in QGIS, desktop geospatial software. Read the blog to learn more about this project.
Best regional-scale visualization
Ecosystems4risk across Africa, by Louise Schreyers, Pierre Lacroix, Karen Sudmeier, Christian Herold, Pascal Peduzzi, and Antonio Benvenuti. This team also chose a custom location and datasets, exploring the intersection of forest management practices and flood risk across the African continent, using forest coverage data and flood population exposure. Read their blog to learn about this project.
Best submission from a World Bank-designated “Low-Income”, “Low-Middle-Income” or “Upper-Middle-Income” economy
Settlements with High Risk of Floods in Monrovia, by Ana Gonzalez. A newcomer to the field of data visualization, Ana nevertheless dove into the VizRisk Challenge data from Liberia and used Tableau, QGIS, and Excel to create a crisp interactive dashboard. Read the blog to learn about this project.
Best beginner submission
Going North, by Zarith Pineda. Having less than a year’s experience in data visualization didn’t stop Zarith from building a map and data dashboard using Esri’s Web AppBuilder with a custom Mapbox basemap to explore how natural hazards in Central America may be precipitating and contributing to human migration. Read the blog to learn more about this project.
Submissions
Ahmad Zia Wahdat, United States
Blog: https://medium.com/@ahmadzia.afghan/a-decade-of-u-s-weather-disasters-hazards-exposure-and-vulnerability-7eeef46b3699?source=friends_link&sk=4c09574a40d3c7f1e74440a9c600ba26
Project: https://awahdat.github.io/vizrisk_2020/
Alexandre Martinez, United States
Blog: https://sites.uci.edu/alexm/2019/07/13/u-s-billion-dollar-weather-and-climate-disasters/
Project: https://public.tableau.com/profile/alexandre.martinez#!/vizhome/usBillionDollarWeather_v3/Dashboard
Alexandre Martinez, Global
Blog: https://sites.uci.edu/alexm/2019/07/14/visualization-the-international-disaster-database/
Project: https://public.tableau.com/views/Globaldisasters1989-2019/Dashboard1?:embed=y&:display_count=yes&publish=yes&:origin=viz_share_link
Ana Gonzalez, Monrovia, Liberia
Blog: https://medium.com/@sofiagonz_4523/identifying-settlements-of-high-risk-of-floods-in-greater-monrovia-liberia-b71ac13249cd
Project: https://public.tableau.com/profile/ana2543#!/vizhome/InteractiveMapMonrovia/Sheet1
Angela Maria Henao O., Luis Sandia, Lorenzo Vasquez, Herve Jegat, Lindys Vivas Monrovia, Liberia
Blog: https://medium.com/@hangelamaria
Project: https://angelahenao.github.io/Comparison2009-2100ClimateChange/
Angela Maria Henao O., Luis Sandia, Lorenzo Vasquez, Herve Jegat, Lindys Vivas, Monrovia, Liberia
Blog: https://medium.com/@hangelamaria
Project: https://angelahenao.github.io/Comparison2100with-witout/
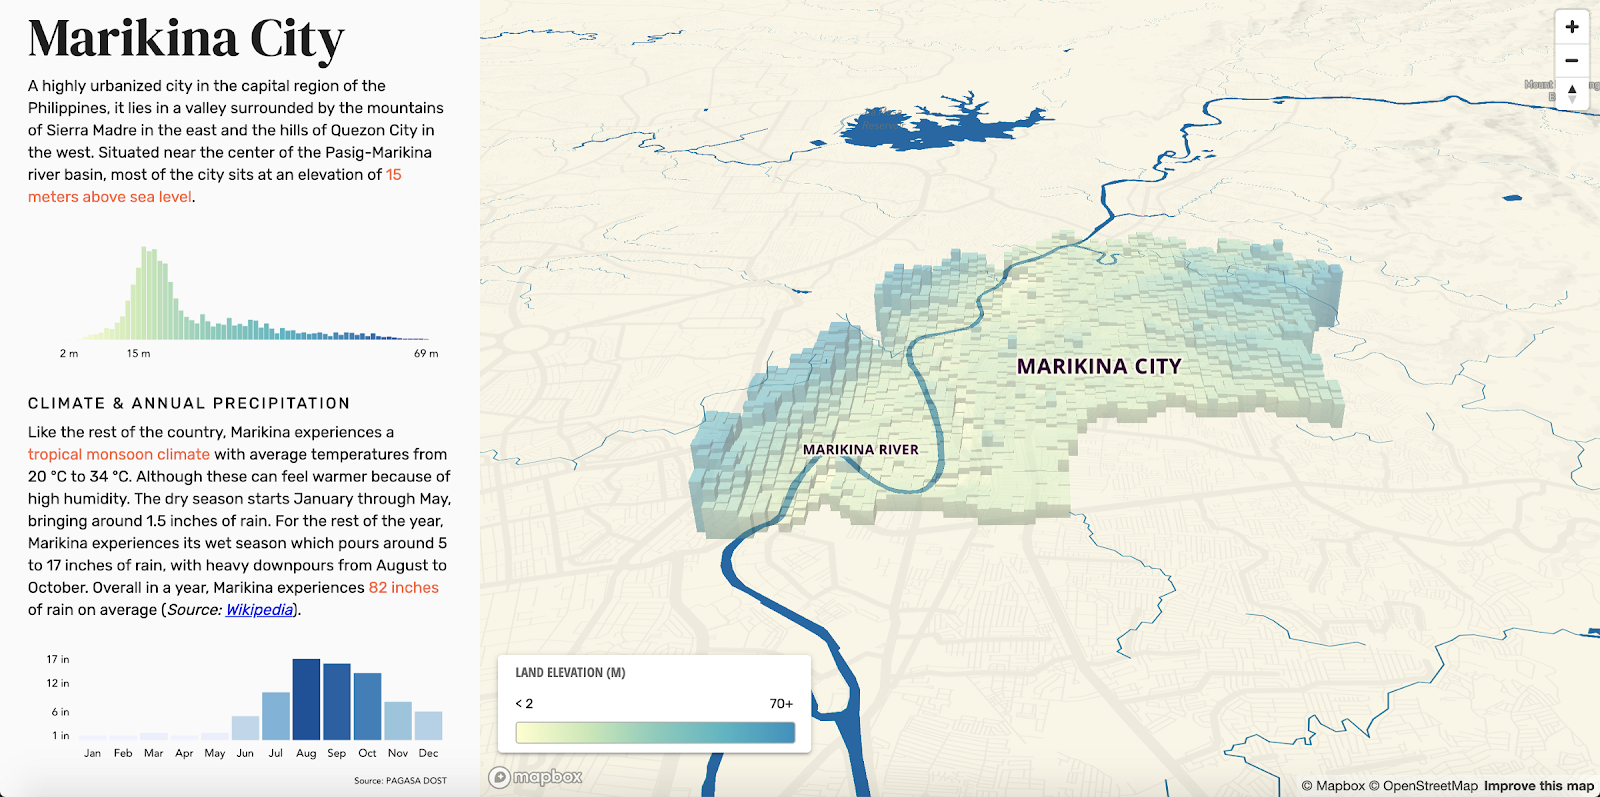
Briane Paul V. Samson, Unisse C. Chua, Marikina City, Philippines
Blog: https://medium.com/dlsu-comet/vizrisk-flooding-in-marikina-city-a-case-study-2a59cf0dd1ba Project: https://comet.dlsu.edu.ph/riesgo-vis/
Daina Andries, Nepal
Blog: https://medium.com/@daina_54650/exploring-risk-of-landslides-in-nepal-5e65edc762f1
Project: https://andriesd.shinyapps.io/nepal_landslide_risk/
David Neudecker, Nepal
Blog: https://www.davidneudecker.com/blog/vizrisk-challenge
Project: http://neudecker.cz/vizrisk.html
Giuseppe Molinario, Sue Lim, Sneha Malani, Pamela Cajilig, Wahaj Habib, Chiang Mai, Thailand
Blog: https://medium.com/ur-field-lab-chiang-mai/living-with-water-d9b671296ba6
Project: https://uploads.knightlab.com/storymapjs/eacd19c3deec43c72d4926118a7dbf07/living-with-water/index.html
Ikramullah Quraishi, Afghanistan
Blog: https://medium.com/@ikram.mis/flood-risk-mapping-in-afghanistan-an-interactive-web-mapping-app-801c40bd763
Project: http://52.175.33.129:8091
Jenna Epstein, Nepal
Blog: https://medium.com/@jennaepstein93/vizrisk-challenge-an-exploration-of-landslide-risk-and-education-in-nepal-e2561f9c59e3
Project: https://public.tableau.com/profile/jenna.epstein#!/vizhome/LandslideRiskandEducationinNepal/NepalDistrict-LevelSchoolDataandLandslideRisk
Karen Barns, Ji Su Lee, Nicole Paul, Tim Arioto, Tamika Bassman, Angela Wilson Caribbean
Blog: https://medium.com/@kjbarns/visualizing-hurricane-marias-impacts-in-dominica-for-the-vizrisk-challenge-623f0b19dc33?sk=3a05dd5bb1ca218120386e9cdc3b6592
Project: http://bit.ly/vizrisk-dominica
Louise Schreyers, Pierre Lacroix, Karen Sudmeier, Christian Herold, Pascal Peduzzi, Antonio Benvenuti, African continent
Blog: https://www.mapx.org/news/ecosystems4risks/
Project: https://bit.ly/30tLsML
Olaf Neussner, Abuyog, Leyte, Philippines
Blog: https://medium.com/@olafneus/where-is-it-safe-to-build-35e1b49722c2
Project: https://floodproofingprojectofgiz.000webhostapp.com/
Rizki Fadhilah, Hanfie Vandanu, Aulia Arfida, Mahendra Aulya, Rooseno Rahman D., Bali, Indonesia
Blog: https://cityplan.id/blog/visualizing-risk-mt-agung-bali-indonesia/ Project: https://hanfiev.github.io/vizrisk/
Sabine Loos, Karen Barns, Arogya Koirala, Nepal
Blog: https://www.sabine-loos.com/blog-1/afterquake-visrisk
Project: http://afterthequake.surge.sh/
Vincenzo Montefusco, Nepal
Blog: https://medium.com/@vincenzo0mon/explore-and-communicate-landslides-risk-in-nepal-using-interactive-maps-b94dcffb9f5c
Project: https://www.vincenzomontefusco.com/deepmoire/VizRiskNepal/
Will Chase, Global
Blog: https://www.williamrchase.com/post/visualizing-risk-remotely-triggered-earthquakes/
Project: https://www.williamrchase.com/vizrisk/vizrisk_main/
Zarith Pineda, Northern Triangle, Central America
Blog: https://www.territorialempathy.com/post/going-north-vizrisk-2019 Project: https://terrempathy.maps.arcgis.com/apps/webappviewer/index.html?id=0724632535ef440d8cbb0c447b759b35