#VizRisk Challenge – Locations & Datasets
The Labs team at GFDRR and partner country programs have prepared four suggested locations and recommended datasets to help inspire you and get you started.
You are also welcome to select another geography and search for other datasets (we encourage you to use open data as much as possible).
Based on the UR Field Lab in Chiang Mai, Thailand, we have added in another location full of new data!
Urban Flooding in Chiang Mai, Thailand [city scale]
Chiang Mai is a flood-prone urban area in northern Thailand with around 1 million residents. It’s a cultural center of the region, with hundreds of Buddhist temples and numerous important holidays and festivals. It is also a technology hub, and a destination for Thai and international software developers who want to participate in the rapidly growing digital economy. In 2017 the national government announced major investments aimed at helping Chiang Mai become a “smart city.” In Chiang Mai along with many other cities around the world, flood risk is increasing due to growing population, changing land-use and climate change. Floods are becoming increasingly frequent, limiting the ability of cities to achieve sustainable and equitable development. How can the risk of floods, especially to the most vulnerable populations, be communicated effectively to different user groups?
The month-long UR Field Lab: Chiang Mai Urban Flooding un-conference has spent the last few weeks collecting various datasets:
- Data repository
- Hazard datasets
- Chiang Mai GeoNode (data is currently being uploaded, so check back later for more datasets if you don’t find what you are looking for)
Flooding in Monrovia, Liberia [city scale]
The capital city of Liberia is growing rapidly, including the expansion of informal settlements and residential and commercial infrastructure. At the same time, flooding – both from storm events and sea-level rise – has been a repeated and mounting threat. How can local government officials better understand, predict, prevent, and recover from flooding? What infrastructure is most vulnerable? Where might flood impacts be the most severe, or the most preventable?
- Hazards:
- 100-year river (fluvial) flood hazard for Liberia (.tif) (geojson) – from Fathom
- 100-year rainfall (pluvial) flood hazard for Liberia (.tif) (geojson) – from Fathom
- These files are from the SSBN Global Flood Hazard dataset, which shows maximum expected water depth in metres at a 1-in-100 return period. Two primary types of flood hazard are modelled: fluvial (caused by rivers overtopping their banks) and pluvial (caused by extreme local rainfall). Urban flood hazard analysis usually combines risk from fluvial and pluvial flooding. For a more detailed introduction to these data and expected performance, see the open-access peer-reviewed paper.
- Global 100-year flood hazard (GeoTIFF) by JRC
- ThinkHazard profile: Monrovia
- Note: By clicking on the data source name, you can download any data that are openly available through ThinkHazard. All data are stored on the GFDRR Innovation Lab GeoNode. Data with commercial limitations on sharing are not available to download.
- Potential vulnerabilities:
- Informal settlements
- Roads and other infrastructure
- Download data from OpenStreetMap
- Background context:
Landslides in Nepal [national scale]
In the many mountainous areas of Nepal, landslides – both during monsoon season and from earthquakes – are a recurring threat. Landslides can have severe and lasting damage on infrastructure and livelihoods. How can national officials and organizations reduce the negative impact of landslides? Which communities are most vulnerable? How might the loss of a road impact people’s travel times? Where might impacts be the most severe, or the most preventable?
- Hazards:
- NASA Global Landslide Catalog (vector)
- SRTM 90m Digital Elevation Database v4.1 (CGIAR CSI)
- Landslides layer (UNISDR) (raster)
- ThinkHazard! profile: Nepal
- Note: By clicking on the data source name, you can download any data that are openly available through ThinkHazard. All data are stored on the GFDRR Innovation Lab GeoNode. Data with commercial limitations on sharing are not available to download.
- Potential vulnerabilities:
- Schools and other infrastructure (available from OSM) exposed to landslides
- Download data from OpenStreetMap
- Background:
Hurricane hazards in the Caribbean [regional scale]
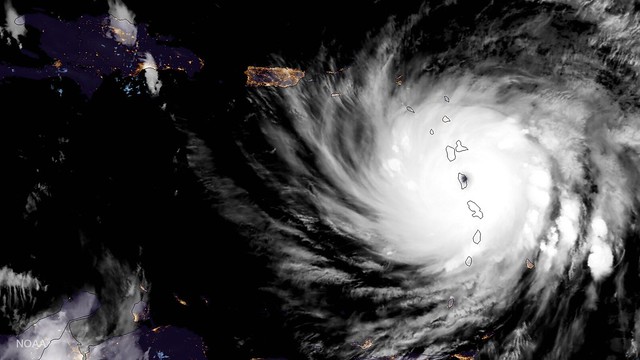
In 2017, Dominica saw over 90 percent of all buildings—including government facilities— damaged by Hurricane Maria. The majority of the damage was from the hurricane force winds that battered the island. Many other Caribbean islands are regularly impacted by hurricanes, and for small island nations, the scale of threat and potential damage can be very challenging to translate into actionable plans for governments or citizens. How can national officials and organizations better plan for hurricanes? What infrastructure is most vulnerable? Where might impacts be the most severe, or the most preventable?
- Hazards:
- Gust footprints of hurricane force winds (NOAA)
- Historical wind-events and paths (U.S. National Hurricane Center)
- Landslides / flooding in Dominica
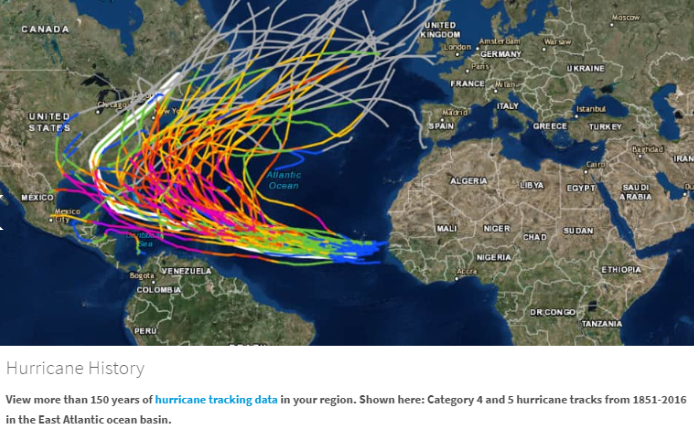
- You can visualize past hurricane events at: https://coast.noaa.gov/hurricanes/. As an example, below are plotted all historical tracks for Category 4 and 5 in the Caribbean
- Potential vulnerabilities:
- Dominica Hurricane Maria Building Damage Assessment (UNITAR)
- Download data from OpenStreetMap
- World Bank Data on Dominica
- Background:
Or choose another location and hazard!
You may also choose your own area and data of interest (we highly encourage you to use only open data.)
For more on working with risk and hazard data, and links to other recommended databases, see understandrisk.org/vizrisk/data.